Material Summary of Geographic Information System (GIS)
Loading...
Components of a Geographic Information System (GIS) is a computer system that is used to enter, check, store, manipulate, integrate, analyze, and display data relating to various locations on the face of the earth.
now, on this occasion, we will discuss in more detail related to Geographic Information Systems (GIS) ranging from understanding to complete examples.
Listen carefully to the review below until it's finished!
list of contents
Definition of Geographic Information System (GIS)
Geographic Information System comes from 3 combinations of words, namely: System, Information, and Geographic.
From these three words, it can be understood that the Geographic Information System is a system that contains information related to the state of the Earth from a spatial point of view.
Have you studied remote sensing before?
Because remote sensing and Geographic Information Systems (GIS) cannot be separated, it is therefore important to study both.
GIS is a special system for processing a database whose contents are in the form of geographic reference data and have spatial information.
Many GIS data inputs are obtained from remote sensing images.
All the information is then processed using a computer which can then be combined into the desired information.
So that it can be said, GIS is a system whose function is to manage, collect, store, and present all data related to geographical conditions in an area.
Geographic Information System Components

The graphic information system was created with several interconnected components, the components of the graphic information system include the following:
1. Hardware (Hardware)
This hardware is in the form of equipment that can support GIS work.
Examples include CPU, printer, monitor, scanner, digitizer, plotter, CD rom, VDU, and flash disk.
The following are the hardware parts along with their functions, namely:
- CPU (Central Processing Unit): Is a computer main device that functions for processing all instructions and programs.
- VDU (Visual Display Unit): Is a component that is used as a monitor screen to display the results of CPU processing
- Disk drive: One part of the CPU that functions to run a program.
- Tape drive: Being one part of the CPU that is useful for storing data processing results.
- Digitizer: A tool for converting electrical data into digital data (digitizing).
- Printer: A tool used to print data or maps with a relatively small size.
- Plotter: Functions like a printer, used to print maps but the output is wider.
2. Software (Software)
Software is a component of a graphic information system in the form of various GIS work support programs such as data processing, data input, and data output.
The software in the geographic information system has functions to process, store, analyze, and present geographic information.
The main components of a geographic information system consist of:
- Database management system.
- Tools for doing geographic data entry and transformation.
- Tools used to support analysis, geographic queries, and visualization.
- Geographical User Interface (GUI) which allows for easier access to geographic tools.
Examples of software from GIS are work programs such as Q-GIS, ArcGis, and ArchView.
3. Data
Geographic data is a component in geographic information systems.
This GIS works by using two geographic data models, namely the vector data model and the raster data model.
In the vector data model, information on the position of points, lines, and polygons is then stored in the form of x, y coordinates.
Shapes of lines, such as roads and rivers are described as a collection of various point coordinates.
As for raster data, it consists of a set of grids and cells such as scanned maps and images.
The data can be displayed in the form of photos or satellite imaging.
4. Human (User/ Brainware)
Humans as users (brainware) are implementers who have responsibilities in the process, collection, analysis, and publication of geographic data.
It is the brainware component that will process the data from the field to be processed or digitized into a map that can be used for certain needs according to its function.
5. Method
A good geographic information system has a harmony between the design of the plan and the final purpose of the analysis.
The use of the method must be in accordance with the availability of data.
Not only that, the accuracy of the analysis results must be the same as the actual conditions in the real world.
Those are some of the components of a geographic information system.
GIS Work Stages

As a system, there are stages of GIS work which include:
1. Input Stage (Input)
The first stage in a GIS work stage is the input stage.
This one input stage consists of data sources and the process of entering data, namely:
a. Data source
The first thing you have to do is prepare the data that will be input into the GIS system.
The various data can be sourced from:
- Remote sensing data such as images, either photo images or non-photo images, aerial photo data, and satellite images.
- Terrestrial data and data from the field such as data on water salinity, soil pH, population distribution, rainfall, data on positive Covid patients, and others. This terrestrial data can be presented in the form of tables, maps, graphs, or calculation results only.
- Map data in general has been in the form of digital maps. There are spatial data of roads, rivers, land use, and others. You just need to input according to the needs of manufacture.
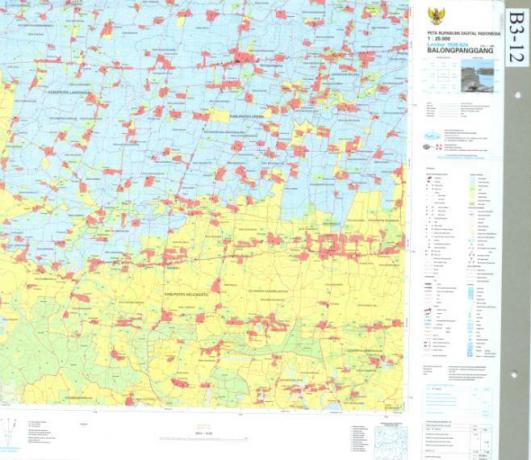
Source: Digital Earth Map of Indonesia, Balongpanggang District, Gresik
b. Data Entry Process
After the required data has been collected, it can be directly entered into the GIS application.
There are two types of data that you can input in a GIS, namely:
- Spatial Data
Spatial data is a data or information that has a reference or geographic coordinates.
You can enter spatial data into a GIS system in two ways, namely digitizing or scanning.

An example of the digitized results of the Earth Map, Balongpanggang District, Gresik
- Attribute Data
Attribute data is data that will provide information regarding every object, phenomenon, or information that is on earth.
In attribute data, an object can be in the form of qualitative and quantitative data, namely:
- Qualitative data is an observational data that is expressed in a descriptive form obtained from filling out questionnaires, interviews, and questions and answers. Qualitative data for example on land use maps, such as data on settlements, industrial areas, rice fields, fields and others.
- Quantitative data is data from observations expressed in the form of numbers. In quantitative data serves to show the difference from the value of an object.
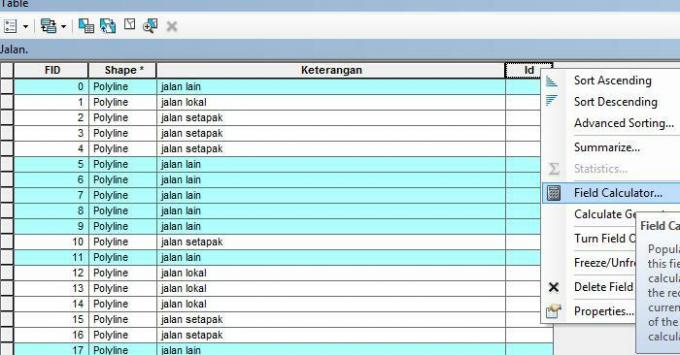
Example of road quantitative attribute data in Balongpanggang Gresik Kecamatan
Advertisement
2. Processing Stage
After you have successfully collected data from various sources and the data has been inputted into the GIS, then you can start the data processing stage.
This data processing stage includes data manipulation and analysis such as:
- Create a new database,
- delete database,
- edit data,
- Fill and insert data into tables.
3. Output Stage (Output)
If your map of the earth has been completed, then you can immediately present it.
You can do the presentation of GIS data in three forms, namely: hardcopy, softcopy, and electronic form (binary form).
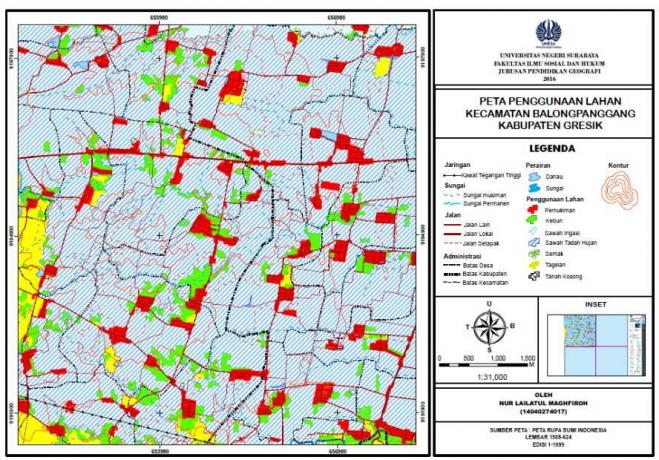
The following is an example of the final results of the GIS work stages from digitizing the Balongpanggang Gresik District.
GIS Data Analysis
GIS analysis can be done in various ways according to the needs of data users such as classification, networking, overlay, buffering, and three-dimensional analysis.
The following is an explanation of each of the points above, including:
1. Overlay Analysis
Overlay analysis is a process used to analyze and integrate (overlap) two or more different spatial data.
For example in the analysis of erosion-prone areas by combining data on elevation, soil type and water content.

Source: Faculty of Marine Science UNRI
2. Classification Analysis
Classification analysis is a process of classifying spatial data (spatial).
Examples are in the classification of land use patterns in agriculture, settlements, plantations, and forests based on data analysis.
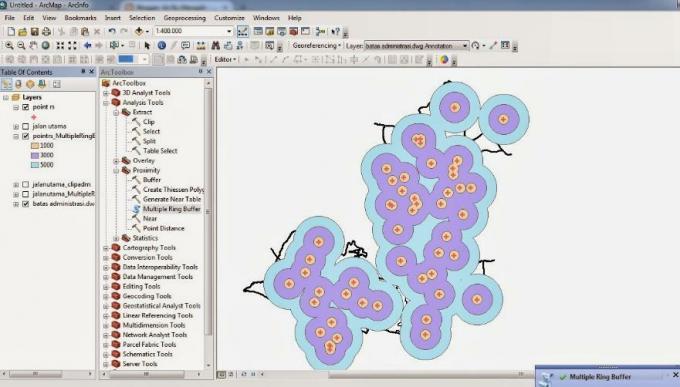
3. Buffering Analysis
This one analysis will produce a buffer with the shape of a circle or a polygon that includes an object as the center.
By using this one buffering analysis, you can find out how many parameters the object has and its area.
4. Networking Analysis
This analysis is based on a network consisting of various lines and points that are connected to each other.
In networking analysis, it is also often used in telephone network systems, oil or gas pipelines, electricity cables, to drinking water pipes and sewers.
5. Three Dimensional Analysis
This one analysis is used to facilitate understanding because the data is visualized in three-dimensional form.
Its application can be used to analyze areas prone to disasters.
Benefits of Geographic Information Systems

The following are some of the benefits of geographic information systems that you need to know, including:
1. GIS for Development Planning
Development planning using GIS can be done through analysis of thematic maps.
With this one analysis, you can find out the ability of the land.
For example, in planning the construction of a bus terminal, you can use land use maps, road network maps, transportation route maps, population density maps, and land price maps.
2. GIS for Natural Resources Inventory
The benefits of GIS for the inventory of Natural Resources (SDA) are as follows:
To find out the distribution of various natural resources, for example coal, oil, iron, gold, and other mining goods.
- To find out potential land areas and critical land.
- To know the area of agricultural land and plantations.
- To find out changes in land use.
- To monitor tidal areas to develop agricultural locations and other interests.
- To map the fertility of the soil needed in agriculture.
3. GIS for Transportation Planning
In the field of transportation, this GIS mapping is used for an inventory of public transportation networks, planning for the expansion of the road network system, the suitability of alternative routes, as well as analysis of areas that are prone to various types of accident.
4. GIS for Spatial Planning
GIS is very useful for planning an area.
Data collection and development of various growth and development centers have used GIS.
GIS is also used to determine the distribution of the population.
The distribution of land use, be it for the development of residential areas, industrial areas, schools, and hospitals, all of which also use GIS.
5. GIS for Disaster Mitigation
GIS in disaster mitigation can be used to determine areas that are the main priority in disaster management.
GIS is also used to identify the source of a disaster, determine the location as an evacuation location, identify the area affected by the disaster, or others.
Examples of Geographic Information Systems

The following are some examples of geographic information system applications that you need to know, including:
1. WebGIS Portal
The WebGIS portal (online map) is an example of using GIS for mapping the distribution of Covid-19 which was built by a joint team of experts and researchers from the University of Indonesia (UI).
In this one portal will contain information related to the distribution of the locations of patients who are positive for Covid-19, an overview regional zones based on the susceptibility to transmission of Covid-19, to the distance between patients and facilities health.
2. Geospatial Information System-BPS
Another example of a GIS application was built by the Central Statistics Agency (BPS) under the name Geospatial Information System-BPS in the form of a website.
The site provides a variety of information related to Indonesia's statistical data in the form of maps.
The BPS website address is sig.bps.go.id
In sig.bps.go.id, there are 3 main types of maps presented, namely:
a. Interactive Map consists of:
- Thematic maps (statistical maps) that provide information using social and demographic themes.
- Agriculture and economy
b. Index Map that presents the framework of the statistical work area in a spatial form.
c. Analog Maps is a collection of thematic maps saved in a print-ready format.
Through the sig.bps.go.id page, the public can access inflation data for each city in Indonesia which is presented on a map.
Agricultural statistics, poverty, population, mining, and other data in each region can also be seen through the map.
3. Ina-Geoportal
The Ina-Geoportal site having its address at Tanahair.indonesia.go.id is also an example of a GIS application in Indonesia.
In this one site was built with the Geospatial Information Agency (BIG) to provide Basic Geospatial Information (IGD).
This one site also provides a presentation of thematic disaster maps, maps of the distribution of covid-19, village boundary maps, marine and environmental maps of Indonesia, and many others.
4. One Map Indonesia Program
The One Map Indonesia program is an example of a Geographic Information System application.
Portal in one map was created by the Indonesian government for the needs of various types of policies.
President Jokowi launched the geoportal for Indonesia's one map policy in December 2018 last year.
5. One Map Policy Geoportal
The official website of the One Map Policy Geoportal is located at portalksp.ina-sdi.or.id.
This portal contains 85 thematic maps covering 7 major themes, namely:
- Borderline,
- forestry,
- space planning,
- infrastructure,
- permits and land
- natural resources and the environment,
- And special areas and transmigration.
The seven themes are spread across 34 provinces which are under the authority of 19 Ministries or Institutions involved as IGT Data Guardians.
But data access can only be opened for the authorities.
X CLOSE
Advertisements
X CLOSE
Advertisements
