12 Map Components and Images and Their Functions
Loading...
Map is an alternative information that describes the earth by using a scale comparison certain information, and to present a variety of information in it precisely and accurately, the map requires a component.
The components on the map are mandatory on a map.
This is because the map component will make it easier to interpret, read, and find out the information contained in the map.
But before you know the various components of the map, it's better if you first know the difference between general maps and special maps. Take a good look at the reviews below, OK!
Difference Between General Map and Custom Map

If viewed based on its contents, the map is divided into two parts, namely general and special maps. The following is complete information regarding the differences in each of these types of maps, including:
1. General Map
On a general map itself, it describes part or all of the earth's surface that you see in general.
This map also shows all the sightings on earth. Whether it's a natural appearance (such as lakes, rivers, oceans, mountains, forests, and others) or man-made (such as cities, roads, plantations, ports, and others).
Some examples of general maps include:
a. World map
b. Chorographic Map
A map that depicts all or part of the earth's surface.
For example, a map of the city of Central Java.
c. Topographic maps
Is a map that describes as well as explains the surface of the earth's relief by using various contour lines as an explanation.
These various lines will later show the earth's surface as well as the difference in altitude in a place.
For example roads, rivers, settlements and others.
d. Map of Earth
2. Custom Maps or Thematic Maps
This type of map will generally describe and explain an aspect or a special phenomenon that exists on the earth's surface.
In this one map, symbols are also used which are characteristics that are highlighted according to the theme stated in the title of the map itself.
The examples of thematic maps, namely:
- climate map,
- soil type map,
- geological map,
- land use map,
- population distribution map,
- map of the distribution of flora and fauna,
- population density map,
- distribution map of mining products and others.
12 Pictures of Map Components and Their Functions
The following are the 12 components on the map along with their images and functions that you need to know, including:
list of contents
1. Map Title
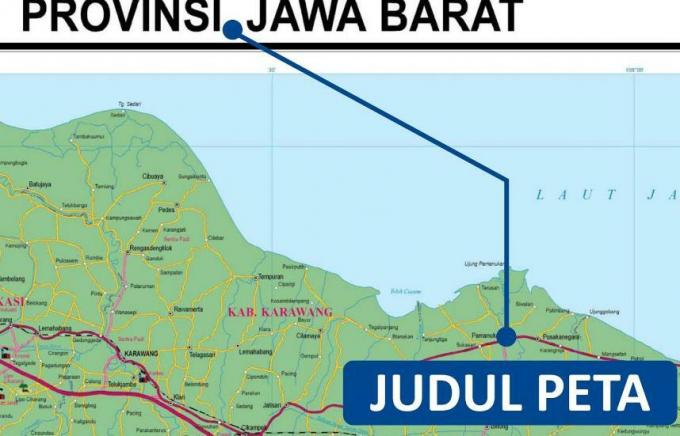
The title of the map is the first thing someone will see when looking at a map.
Usually, the title of this map is at the top center of the map.
If the title of this map is placed on the other side of the map, then the location of the title must not interfere with the appearance of the contents of the entire map.
The title of the map itself contains various information in accordance with the contents of the map information.
2. Astronomical Line
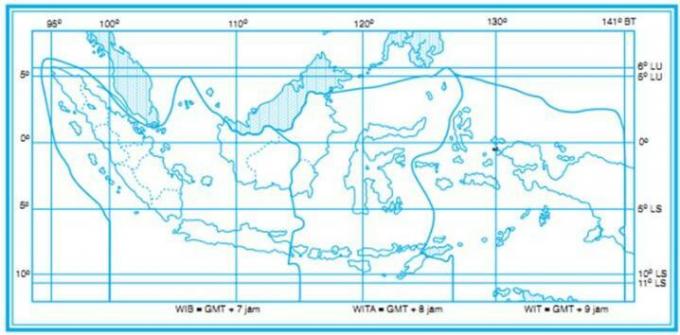
The astronomical line is one of the map components that has a function to determine the absolute position of an object on the main map.
Astronomical lines are also divided into two types, namely latitude and longitude.
Astronomical lines on the map will generally be marked with a dotted line that intersects the outline.
3. Map Outline
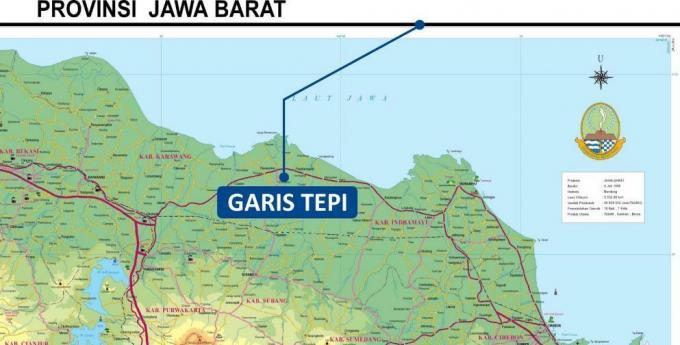
The outline is a line that has a function as a space delimiter on the map.
This one line can make it easier for you if you want to create an area, island, or city so that the image can be right in the middle position.
The general form of this one edge line is a rectangle. And generally created in duplicate with the aim of clarifying the lines made.
4. inset
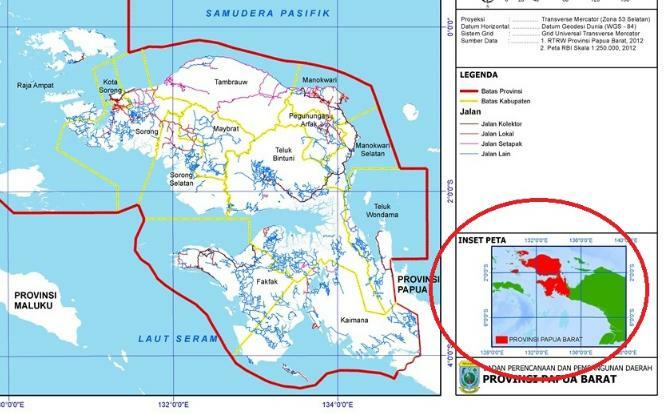
Inset or also commonly referred to as a small map is an indication of the position of the area depicted on the map with its current position along with the wider surrounding area.
In this inset it is generally on the left, right, or on the lower side of the map near the edge.
The main purpose of using this one inset is to help clarify one part of the map.
Not only that, the inset also has a function to show an important location on a map.
5. Map Color
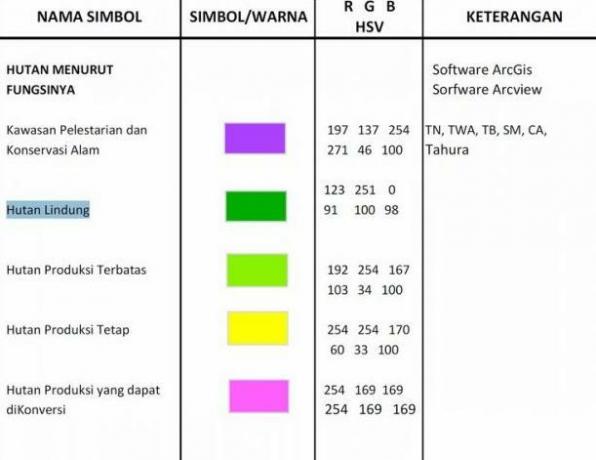
As we know, on a map there are several different colors.
Where the color has a function to distinguish an object of natural appearance and the contours of the surface in each region.
The color is also very much needed on a map to become one of the map symbols and to show the quality of a map that can be seen from an aesthetic point of view.
The color symbols on this map have 8 different color variations, including:
a. Red
For the red color in this one map will usually indicate a railway line or an active volcano.
This red color is often found on provincial maps.
b. Green color
The green color depicted on a map indicates the elevation of an area that is less than 200 meters high.
Areas on earth with an altitude of less than 200 m will generally be dominated by lowland areas.
You can find lowlands, especially in the area of the island of Java, along the North coast and the South coast of Java Island.
c. Yellow
The symbol for the yellow color on a map is defined as an indication of an area that has an altitude between 500 to 1000 m above sea level.
The area marked in yellow is usually dominated by highlands, hills, and low mountains.
The distribution of the contours of the earth's surface, which are highlighted in yellow, is located on the edge to the center of the province of Central Java. To be precise, it is in the southeastern area of Sukoharjo Regency, Central Java.
Advertisement
d. Light Green Warna
If earlier we discussed about the green color on the map, then there is another light green color which will also describe the altitude in an area that is between 200 to 400 m above water level sea.
e. Brown
This brown color shows a highland area with an altitude ranging from more than 1500 m above sea level.
The distribution of the area at an altitude of above 1500 m is mostly found in the Central Java region.
f. Light brown
It turns out that in a map there is also an area color that is dominated by the use of light brown.
This area has an altitude of 1000 to 1500 m above sea level.
The dominance of the region which has a symbol with a light brown color is usually in the form of low mountains and mountains of medium height.
The distribution of this form of the earth's appearance is widely found in the Central Java area. Precisely in the area of Bumiayu, Temanggung, Banjarnegara, Wonosobo, Salatiga, and Tawangmangu.
g. Light Blue Color
For light blue this one will show a depth of between 200 to 2000 m.
The basic shape of the earth's surface, which is marked with a light blue color, is generally dominated by a slightly steep slope.
And for the light blue color depicted on the map which is part of this one water area, it is a continuation of the neritric zone.
Where in this light blue color is rarely found in general maps. Because usually what is often used is a light blue symbol on a special map of an area.
h. whitish blue color
The dominant blue color on a map will generally indicate the water area.
However, this particular whitish blue color will generally only describe water areas with a depth of less than 200 m.
This one water zone is generally called the neritric zone. Or the shape of the earth's surface that is on the seabed and has a gentle slope.
In this zone, it is usually often found in coastal areas.
Not only in sea waters, this one color is also often seen in land waters.
The whitish blue color found in inland water areas will generally be found in swamps or lakes.
Reservoirs whose names are often heard on the island of Java are Gajah Mungkur Reservoir in Wonogiri, Wadaslinang Reservoir in Kebumen, Sempor Reservoir in Kebumen, Rawa Pening in Bawen area, and many other reservoirs and swamps other.
i. Dark Blue Color
The dark blue color in this map indicates an area of water that has a depth of more than 2000 m.
Because the depth of the waters is too deep, it makes it difficult to interpret the contour drawings of the bottom of the waters on a map.
However, the dark blue color that exists in this deep sea will generally be in the form of sea depths, sea trenches, plains, and drempel.
Similar to the light blue color that cannot be found on general maps, this dark blue color also does not exist on a general map.
6. Map Scale
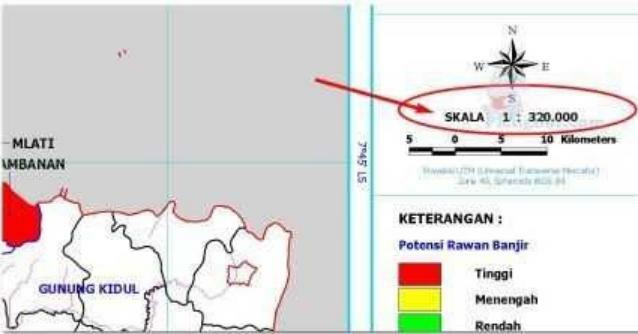
The map scale consists of a number whose function is to compare the actual distance in the field with the distance on the map.
On a scale of one this is generally right at the bottom of the map title.
This supporting element is a vital element because it can help the reader to know the actual distance and area in the field.
For example, there is a scale of 1: 100,000, so that scale means that 1 cm on the map represents 100,000 cm on the ground.
7. Map Symbol

As previously mentioned, the map will display information that is visible or not.
In order to display phenomena and forms in an informative way, a symbol is used.
This map symbol is used to represent the actual object.
In order for the symbols used in the map to provide accurate information, the symbols must be simple, easy to understand, and general in nature.
When viewed from the shape, there are seven categories of map symbols, including:
- A dot symbol to represent the location of a place or data position. For example, symbols of cities, mines, mountains, triangulation points (high points) that exist from sea level.
- Line symbols to represent geographic data. For example, boundaries, rivers, and roads.
- The symbol of the region (region) to describe the appearance of the region. Examples are swamps, forests and deserts.
- Flow symbol to describe the flow and motion of a phenomenon.
- Bar symbols to indicate the price of a phenomenon or compare it with the price of another phenomenon.
- Circle symbol to indicate the quantity that is in the form of a percentage.
- Ball symbol to indicate volume (content). The bigger the ball, the bigger the volume. And vice versa.
Meanwhile, if viewed from its nature, there are qualitative and quantitative symbols.
This qualitative symbol is used to distinguish the distribution of the intended phenomenon without using a firm measure.
And for this qualitative symbol is used to mention or distinguish the value of the phenomenon described.
Various quantitative symbols will generally show a gradation of values in the form of shading and color.
8. Legend
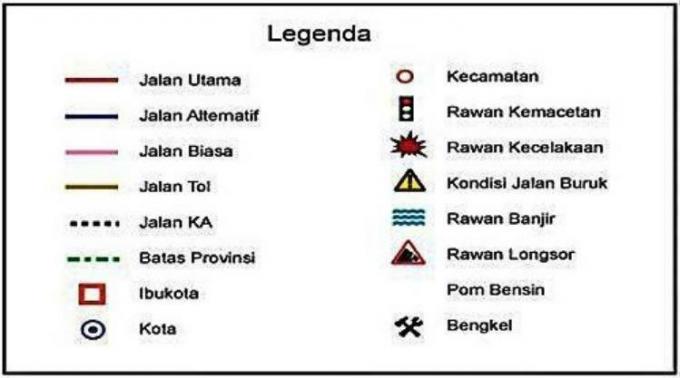
The legend is one of the supporting elements on the map and is often found in a box and in the corner.
In this legend it is often dubbed as an explanation.
Because the map is an information that covers an area and is generally contained in the form of images and symbols.
Therefore, this one legend is needed to help the reader when he will understand the images and symbols listed on a map.
Legends are generally written briefly, concisely, and clearly with the aim of making them easy to understand by readers.
Often you will also find this legend in the lower corner.
But keep in mind that not all types of maps put this one legend at the bottom corner of the map.
The legend can also be placed on the other side which if it will not interfere with the appearance on the map. So that the map still looks neat and attractive.
9. Cardinal Direction/ Orientation
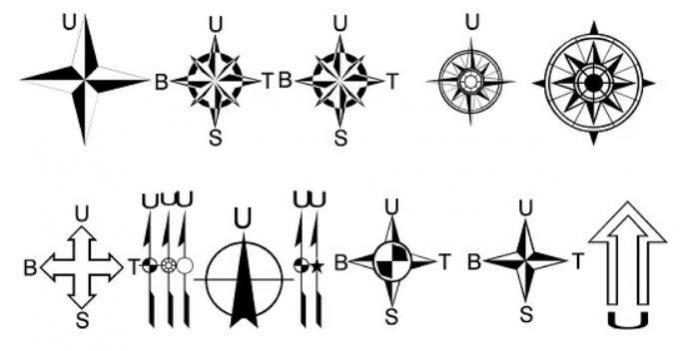
Components and supporting elements on a map on this one have the form of arrows which will generally indicate the orientation towards North.
This one cardinal direction is very important because as a pointer to the 8 cardinal directions, namely East, South, Southeast, West, Southwest, Northwest, North, and Northeast.
The orientation of the cardinal directions is flexible because it can be placed anywhere on the condition that it will not interfere with other map components.
The thing you need to note is that the orientation of the cardinal points does not always go north. But it can also be to the West or South.
10. Type of Letters (Lettering)

Lettering or also commonly referred to as map writing has its own standard rules that distinguish it from various other geographical objects that are usually displayed on a map.
This one lettering also has a function to clarify the meaning of the symbols that are already available.
There are also 2 types of lettering, including:
- Hydrographic Objects: Usually written in italics. Example: In the Java Sea.
- Hipsographic Objects: Usually printed using upright letters. Example: Surakarta.
11. Latitude and Longitude
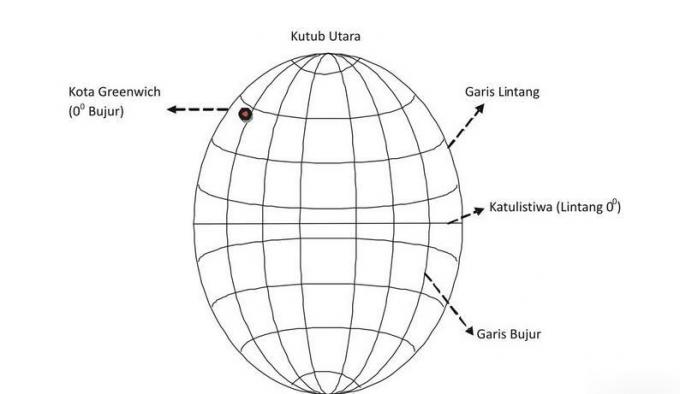
Latitude is a line on a map that runs from west to east or vice versa.
Meanwhile, longitude is a line that runs from south to north or vice versa.
12. Source and Year of Map Creation
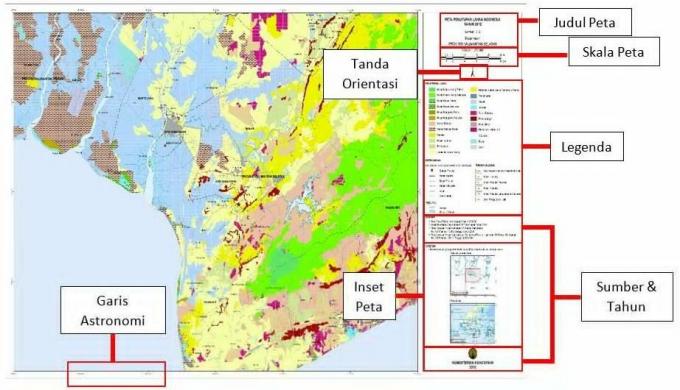
The supporting elements or also commonly used as the next map component are the source and year of the map.
For the supporting elements of this one map, it is a very important thing on a map, it even becomes a mandatory component that must exist and be included when making a map.
Source and year of manufacture of maps has a very important function regarding the reliability of a map.
There may be a lot of questions flowing why the source and year of manufacture in a map should be included?
This was done because the source and year of making this one map were also used to guide the data used in a mapping.
Where it aims to provide a definite and accurate presentation of information.
In the year of making this map, it also serves to provide information to readers regarding when the map was created.
A map that has good quality is a map where the year of manufacture is still new.
The new map will later present all the information that is still available up to date and complete so that it is suitable to be used for conditions at the present time.
X CLOSE
Advertisements
X CLOSE
Advertisements
