
Standard Deviation: Calculation Formulas and Example Problems
Actually, the formula for standard deviation is quite easy, as long as you know the basis of the standard deviation itself.
Table of contents
Definition

In Statistics and Probability, Standard Deviation or also known as Standard Deviation is a statistical technique used to explain Hhomogeneity in a group.
Standard deviation is also defined as a statistical value that is often used in determining how the data is distributed in the sample, as well as how close the individual data points are to the mean or average of the values of the sample alone.
The standard deviation is defined by the square root of variance, because the number is a positive number and has the same units as data.
For example: If a data is measured in meters, the standard deviation must also be measured in meters.
word Standard Deviation first introduced in 1894 by Karl Pearson in his book entitled On The Dissection Of Asymmetrical Frequency Curves.
Introduction

Before you learn more about the standard deviation formula, there are a few things you should know first.
The standard deviation value derived from the data set can be = 0 or even greater or less than zero (0).
Under the condition:
- If the value is equal to zero, then all the values in the set are the same.
- Meanwhile, if the value is greater or even smaller, it indicates if the data points of the individual are far from the average value.
The first step What you need to do to find the standard deviation is as follows:
- Calculates the mean or average value at each available data point.
- The mean or average value is equal to the sum of each of the values contained in the data set.
- Then you divide by the total number of points in the data.
Next step:
Calculates the deviation at each data point from its mean or average value. That is by subtracting the value from the mean value.
Next, you square the deviation at each data point and then find the mean individual square deviation.
The resulting value is referred to as variant.
After that, to find the standard deviation, that is by taking the square root of the variance value.
Formula
The way to calculate the standard deviation is actually quite easy if you have memorized or know the formula for the standard deviation itself.
We take an example, if we know a set of quantitative data that is not grouped and is expressed by x1, x2, …, xn.
So from the data above we can get the standard deviation value (S) which is determined using the formula below:
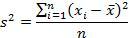
1. Standard deviation for population

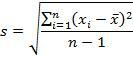
2. Standard deviation formula for sample

3. Calculation
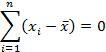
One way or method of knowing the diversity of a data group is by subtracting each data value by the mean of the data group. Then all the results are added up.
However, this method cannot be applied because the result will always be 0.
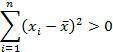
Therefore, the solution so that the result is not 0 is by squaring each reduction in the value of the data and the mean of the data group.
Then the summation is done. The result of the sum of the squares (sum of squares) will always be positive.
The variance value will be obtained from the division of the sum of the squares (sum of squares) along with the data size (n).
However, in its application, the value of the variance can be used to estimate the variance of the population. By using the above formula, the value of the population variance will be greater than the sample variance.
Therefore, in order not to be able to estimate the population variance, then n used as the divisor of the sum of the squares (sum of squares) we replace by using n-1 (degrees of freedom) so that the sample variance value is close to the population variance value.
Therefore, the sample variance formula will be:
The variance value obtained is a value in the form of a square.
For example, if the unit of the mean is grams, then the variance will also be in the form of grams squared. To equalize the unit values, we take the square root of the variance so that we get the standard deviation.
To make the calculation easier, the formula for variance and standard deviation can be reduced to:
4. Variant

5. Standard Deviation

Information:
- s2: Variant
- s: Standard deviation
- xi: The i-th x value x
- x: Average
- n: Sample size
Problems example
- Standard Deviation
Problem 1.
In Rakitan Village, a height measurement activity was held, some local residents who will be used as samples obtained the following data:
172, 167, 180, 170, 169, 160, 175, 165, 173, 170
Calculate the standard deviation of the sample height measurement data above.
Answer:
| i | xi | xi 2 |
|---|---|---|
| 1 | 172 | 29584 |
| 2 | 167 | 27889 |
| 3 | 180 | 32400 |
| 4 | 170 | 28900 |
| 5 | 169 | 28561 |
| 6 | 160 | 25600 |
| 7 | 175 | 30625 |
| 8 | 165 | 27225 |
| 9 | 173 | 29929 |
| 10 | 170 | 28900 |
| ∑ | 1710 | 289613 |
So that we can know, from the calculation of the data above, the total amount of data is (n) = 10 and (n-1) = 9.
Question 2.
In a class that has 40 students, then the class will be used as a sample to measure the height of 9 students, and the following data are obtained:
165, 170, 169, 168, 156, 160, 175, 162, 169.
Calculate the standard deviation of the sample data above.
Answer:

So it is known that the standard deviation value is 5.83.
Problem 3.
Calculate the standard deviation of the Mathematics test scores of 71 grade 12 students of SMA Pelita as shown in the table.
Answer:
We get = 65.7.
| xi | fi | xi – | (xi – )2 | fi (xi – )2 |
|---|---|---|---|---|
| 42 | 3 | –23,7 | 561,69 | 1.685,07 |
| 47 | 4 | –18,7 | 349,69 | 1.398,76 |
| 52 | 6 | –13,7 | 187,69 | 1.126,14 |
| 57 | 8 | – 8,7 | 75,69 | 605,52 |
| 62 | 10 | –3,7 | 13,69 | 136,9 |
| 67 | 11 | 1,3 | 1,69 | 18,59 |
| 72 | 15 | 6,3 | 39,69 | 595,35 |
| 77 | 6 | 11,3 | 127,69 | 766,14 |
| 82 | 4 | 16,3 | 265,69 | 1.062,76 |
| 87 | 2 | 21,3 | 453,69 | 907,38 |
| 92 | 2 | 26,3 | 691,69 | 1.383,38 |
| fi = 60 | fi (xi – )2 = 9,685.99 |
- Standard Deviation of Group Data
Problem 1.
In Joho Village, height measurements were held, several local residents were then used as samples, so that the following data were obtained:
172, 167, 180, 170, 169, 160, 175, 165, 173, 170
Calculate the Standard Deviation of the Group Data against the sample data above.
Answer:

How to calculate Standard Deviation manually:
manual
From the above calculation, it is known that the variance value is 30.32.
Therefore, to calculate the standard deviation only requires square root of variance value that, that is s = 30.32 = 5.51
Thus, the value of the standard deviation of the group data is 5,51.